Tuesday, September 30, 2014

Warm water extends from Laptev Sea to North Pole

The NOAA NESDIS image below shows sea surface temperature anomalies of well over 1ºC extending to the North Pole.


The image below gives a world view, showing SST anomalies at the top end of the scale in the Laptev Sea.


The top end of the scale on the above image is 5ºC (or 9ºF).


The visualizations above and below uses a much higher scale. Even this higher-end scale doesn't appear to fully capture the dire situation we are in.


Above image shows warm water entering the Arctic Ocean through the Bering Strait and from the North Atlantic. For months to come, the Gulf Stream will keep pushing warm water into the Arctic Ocean (i.e. water that is warmer than the water in the Arctic Ocean). It takes some time (i.e. months) for the warm water from the north Atlantic to arrive in the Arctic Ocean.

Last year, methane emissions started to become huge in October and this lasted for some six months. The image below, from an earlier post, shows methane eruptions from the seafloor of the Arctic Ocean on October 16/17, 2013.


The image below, from another earlier post, shows methane eruptions from the seafloor of the Arctic Ocean on October 31, 2013.


The image below, from yet another earlier post, shows methane levels as high as 2662 parts per billion on November 9, 2013.


This year, there is even more ocean heat present, especially in the north Atlantic and the north Pacific. On September 29, 2014, methane levels as high as 2641 parts per billion were recorded and it looks like worse is yet to come.


The video below, Sea floor methane hydrate climate hazard, is an extract produced by Peter Carter from a presentation by Miriam Kastner, uploaded 7 August 2008 at Youtube.


The situation is dire and calls for comprehensive and effective action, as discussed at the Climate Plan blog.


Monday, September 22, 2014

350,000 Marchers = 50 Parts Per Million

People's Climate March, New York, September 21, 2014, photo by Cindy Snodgrass

by Nathan Currier

How big a deal was the march in Manhattan yesterday? One of the organizers was 350.org, a group started by Bill McKibben based on a paper by climate scientist James Hansen which stated that we should aim for about 350 parts per million (ppm) CO2. We are currently at about 400ppm, so we need to move "only" about 50ppm in the opposite direction from our rapid growth, which hit a frightening 3ppm clip last year.

It will take a huge effort, and few alive today will live to see it (short of large-scale engineering), but it is interesting to ponder the minute change this represents in the air -- a shift of just 5 one-thousandths of one percent (.005 percent) of the atmosphere! That is one of the fascinating things in climate science, how such a minute change in our atmosphere could potentially have such an impact on the energy balance of our whole planet.

Keep this in mind if you are trying to contemplate how big a deal it is that some 350,000 people came out into the streets of Manhattan, the capital of capitalism, the cultural heart of the nation where manufactured denial has most stymied action. That's because this happens to be exactly the same proportion of the 7 billion members of humanity, 5 one-thousandths of one percent, as that 50ppm is a shift in the composition of the air. Further, some have estimated the real number of marchers as 400,000, and if the global estimates swell equally, then globally about the same proportion were marching as the CO2 growth since industrialization is a shift in atmospheric composition. In a way, all those marching were just a trace, and as soon as we dissipated into streets and subways afterwards, quickly outnumbered by people going about their everyday lives, that seemed obvious, but in another way, how monumental the right little trace can become!

And speaking of powerful little traces, methane is even far less concentrated in the air than CO2, about 220 times less so, but there was really some methane floating around the Manhattan air yesterday! No, I don't mean all those leaky pipes in the city that have led local tests to sometimes register incredibly high ambient readings of the greenhouse gas. I mean that among the marchers anti-fracking signs often seemed to outnumber all other "sub-theme" signs. This is a fascinating phenomenon, as some of us have felt that, since we all ultimately must live in the here and now, and since one cannot impact the climate we have here and now very effectively through CO2 mitigation, yet one can only gain practical political traction by dealing with that here and now, so one of the best ways to gauge seriousness in getting movement going on climate would be to watch for meaningful action on methane. In a sense, if you want people to start climbing up a very steep ladder, you need to give them a nice low first step, and that first climate step would be methane. As Robert Watson, the previous Chair of the United Nation's Intergovernmental Panel on Climate Change put it succinctly, rapidly cutting methane, "would demonstrate to the world that we can do something to quickly slow climate change. We need to get moving to cool the planet's temperature. Methane is the most effective place for us to start."

The Manhattan climate march also provided a fitting example of how getting the big slow march of change rolling can be frustrating: for those in the back it took two hours to start any movement at all, and then another two hours to reach Columbus Circle, its ostensible starting point. Similarly inevitable drags on climate mitigation are making rapid methane action all the more important. And uncertainties in near-term climate change, with a rising potential for high-impact lower-probability events to cause abrupt heating (like non-human methane emissions in the arctic taking off more quickly than models predict), means that ignoring the near-term climate for too long could ultimately prove fatal to all our best intentions. So it's fascinating to see an interest in methane growing from the grass roots, even if it is still largely (and erroneously) confined to the fracking issue at this point. Let's hope that the interest in this merest little trace gas of our air -- since industrialization it has risen by about 1.1 ppm, a shift of about 1.1 ten-thousandth of 1 percent of the atmosphere! -- sparks soon. The group 1250 was initially intended to provide a kind of autonomous offshoot to McKibben's 350, in order to help generate that spark, but McKibben himself soon said that he "had his hands full with CO2" and did not at the time send along to his followers the group's initial petition drive, which then quickly languished. But if methane interest does reach that critical concentration, and that spark is provided, you know what happens next: that's when climate action goes boom.

Above text was earlier posted by Nathan Currier at the HuffingtonPost 

Below follow further photos by Cindy Snowgrass of the People's Climate March.


Thursday, September 18, 2014

Warm water flowing into Arctic Ocean

by Harold Hensel

For the first time in thousands of years, warm water is flowing into the Arctic Ocean. Warm water from the deep ocean is showing up on surface images. There is no way to put this into the context of 'normal.' Historic temperatures have kept the Arctic frozen on an even keel for thousands of years. Even if there was a 'natural cycle' it has been completely overridden by the astonishing amount of pollution that is going into the atmosphere.


Over 90 percent of Earth's energy imbalance has been going into the oceans, almost unnoticed by people keeping track of the temperatures in the atmosphere. The warmer ocean water is going through the Bering Strait and into the Chukchi Sea, Barents Sea, East Siberian Sea and worst of all, the Laptev Sea.

The Gakkel Ridge crosses the Arctic Ocean from Greenland to the Laptev Sea, see earlier post
There are methane hydrate concentrations in all of these areas up to 1,500 feet deep for miles and miles. There are fractures here that give mantel methane a route to the surface that have been safely sealed by ice. The hydrates and seals are thawing.

In 2013, huge amounts of methane erupted over the Gakkel Ridge and
the Laptev Sea
in October, with levels as high as 2662 ppb on November 9.
In 2014, levels over 2400 ppb were recorded on September 14, 15 and 16.

On the Greenland side, warm water is flowing into the Arctic from the Labrador, Greenland and Norway seas. The international SWERUSs-C3 expedition on the icebreaker Oden is recording 'mega flares' of methane. There are many factors involved in warming the Arctic Ocean, but warm water flowing into it is one of the worst.

Harold Hensel
Cedar Rapids

Sunday, September 14, 2014

Climate Accord New York September 2014

Under the Obama administration, the U.S. has made some (small) progress limiting the amounts of greenhouse gases that states emit, e.g. through Environmental Protection Agency limits on carbon dioxide emitted by power plants.

Given that greenhouse gases do spread all over the globe, the U.S. must also support action abroad to reduce levels of greenhouse gases.

At the upcoming Climate Summit in New York, September 23, President Obama will have a good opportunity to do so.

President Obama can and should support an accord for nations to jointly commit to bold action, including the imposition of fees on fossil fuel exported to nations that fail to commit to such action.

Where necessary, World Trade Organization rules should be agreed to be adjusted in order to accommodate such fees.

An accord on export fees can help U.S. exporters remain competitive and avoid repercussions. Such fees will also help make importing nations impose fees domestically, as they will not want to miss out on the revenues from such fees.

Revenues from such fees are best held in a trust fund and they are best used exclusively to finance international projects, such as efforts to save the sea ice in the Arctic and R&D into ways to decompose methane. As more nations impose fees domestically and accept responsibility to participate in international projects, such export fees can phase themselves out.

The People's Climate March will take place on September 21, starting 11:30 am from Central Park West (between 65th and 86th streets). Whether or not you're taking part in the march, consider supporting the Climate Plan. If you print out above image, you could make a cardboard sign. Over the coming days, photos of people holding up such a sign can be posted and shared at facebook and, if you add some lines saying you like the idea, they will be considered for display at the Arctic-news blog. You can also make it your profile picture on facebook during the remainder of the month to get a chance to be mentioned as a supporter.  Thanks in advance.

Update of Sea Surface Temperature Anomaly below:


Thanks to all who liked, tagged and shared the top image. Two examples of how the message is shared are highlighted below.

Sheila Chambers at facebook                             

A.Randomjack at Google+


Wednesday, September 10, 2014

Methane levels threaten to skyrocket


The World Meteorological Organization’s annual Greenhouse Gas Bulletin shows that between 1990 and 2013 there was a 34% increase in radiative forcing – the warming effect on our climate – because of long-lived greenhouse gases such as carbon dioxide (CO2), methane and nitrous oxide.

In 2013, concentration of CO2 in the atmosphere was 142% of the pre-industrial era (1750), and of methane and nitrous oxide 253% and 121% respectively.

The ocean cushions the increase in CO2 that would otherwise occur in the atmosphere, but with far-reaching impacts. The current rate of ocean acidification appears unprecedented at least over the last 300 million years, according to an analysis in the report.

“We know without any doubt that our climate is changing and our weather is becoming more extreme due to human activities such as the burning of fossil fuels,” said WMO Secretary-General Michel Jarraud.

“The Greenhouse Gas Bulletin shows that, far from falling, the concentration of carbon dioxide in the atmosphere actually increased last year at the fastest rate for nearly 30 years. We must reverse this trend by cutting emissions of CO2 and other greenhouse gases across the board,” he said. “We are running out of time.”

The observations from WMO’s Global Atmosphere Watch network showed that CO2 levels increased more between 2012 and 2013 than during any other year since 1984.


NOAA data give a slightly lower CO2 growth figure for 2013, but even when extrapolating NOAA's data, some frightening trendlines appear, as illustrated by above image. 

The WMO concludes that a reduction in RF (radiative forcing) from its current level (2.92 W·m–2 in 2013) will require huge cuts in a number of emissions, not just in CO2. 

In the figure on the right, the RF of the long-lived greenhouse gases (LLGHG) is plotted along with different emission reduction scenarios: (a) emissions held constant at 2013 levels, (b) constant CO2 emissions and 80% reduction in anthropogenic non-CO2 GHG emissions, (c) 80% reduction in CO2 emissions while non-CO2 GHG emissions are held constant, and (d) 80% reductions in all LLGHG emissions.

A recent study shows that the world not only continues to build new coal-fired power plants, but built more new coal plants in the past decade than in any previous decade. Worldwide, an average of 89 gigawatts per year (GW yr–1) of new coal generating capacity was added between 2010 and 2012, 23 GW yr–1 more than in the 2000–2009 time period and 56 GW yr–1 more than in the 1990–1999 time period. Natural gas plants show a similar pattern.


Assuming these plants operate for 40 years, the fossil-fuel burning plants built in 2012 will emit approximately 19 billion tons of CO2 (Gt CO2) over their lifetimes, versus 14 Gt CO2 actually emitted by all operating fossil fuel power plants in 2012.

The study concludes that total committed emissions related to the power sector are growing at a rate of about 4% per year.

“Bringing down carbon emissions means retiring more fossil fuel-burning facilities than we build,” said Steven Davis, assistant professor of Earth system science at UCI and the study’s lead author. “But worldwide, we’ve built more coal-burning power plants in the past decade than in any previous decade, and closures of old plants aren’t keeping pace with this expansion.”

“Far from solving the climate change problem, we’re investing heavily in technologies that make the problem worse,” he added.

“We’ve been hiding what’s going on from ourselves: A high-carbon future is being locked in by the world’s capital investments,” said Socolow, professor emeritus of mechanical & aerospace engineering.

The IPCC in AR5 suggests there was a carbon budget to divide between nations (above image left), while largely ignoring potentially huge feedbacks such as albedo changes resulting from decline of snow and ice in the Arctic and methane eruptions from the seafloor of the Arctic Ocean.

These two feedbacks alone could each soon cause more warming than the warming directly caused by people's emissions since the start of the industrial revolution.

Sam Carana says: “There is no carbon budget to divide between nations, instead there is just a huge debt of CO2 to be removed from the atmosphere and the oceans. Comprehensive and effective action must be taken to stop run-away warming.”

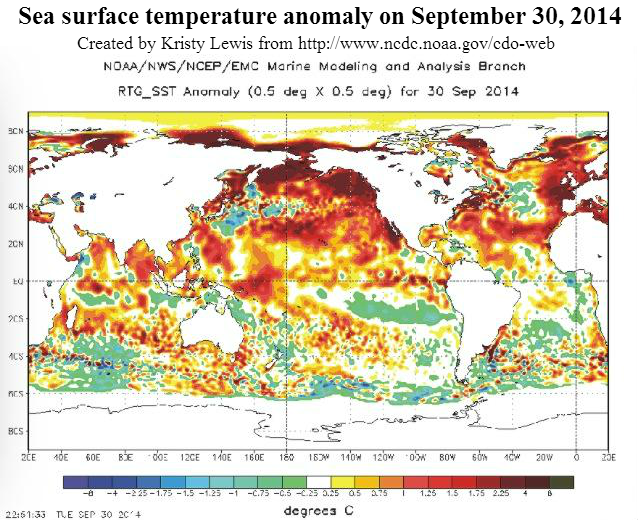
Sam Carana continues: “No time before in human history has such a huge amount of ocean heat accumulated in the North Atlantic and the North Pacific.”

“This heat is now threatening to invade the Arctic Ocean and trigger huge temperature rises due to methane eruptions from the seafloor.”

“The heat is also melting Arctic sea ice from below, as the image below right shows, there now is hardly any sea ice left that is more than 3 meters (nearly 10 ft) thick.”

“Last year, this heat started to cause large methane eruptions from the Arctic Ocean's seafloor in early October, and this year temperatures in the Arctic Ocean are even higher.”

Meanwhile, mean global methane levels of 1839 ppb were recorded at several altitudes by the MetOp-1 satellite on the morning of September 7, 2014.

And ocean heat continues to invade the Arctic, as illustrated by the NOAA image below.


Links

- Record Greenhouse Gas Levels Impact Atmosphere and Oceans - WMO Press Release No. 1002
https://www.wmo.int/pages/mediacentre/press_releases/pr_1002_en.html

- WMO Greenhouse Gas Bulletin No. 10 | 9 September 2014
https://www.wmo.int/pages/mediacentre/press_releases/documents/1002_GHG_Bulletin.pdf

- NOAA Trends in Atmospheric Carbon Dioxide, Annual Mean Global CO2 Growth Rates
http://www.esrl.noaa.gov/gmd/ccgg/trends/global.html#global_growth

- Commitment accounting of CO2 emissions, by Steven J Davis and Robert H Socolow
http://iopscience.iop.org/1748-9326/9/8/084018

- Existing power plants will spew 300 billion more tons of carbon dioxide during use - News Release
http://news.uci.edu/press-releases/existing-power-plants-will-spew-300-billion-more-tons-of-carbon-dioxide-during-use


Saturday, September 6, 2014

Antarctica linked to Arctic

Waters in the Arctic Ocean continue to warm up. Very warm waters from the North Atlantic and Pacific Ocean are invading the Arctic Ocean.


Waters in the North Atlantic and in the North Pacific are very warm, due to a number of reasons.

What is happening in the oceans is very important in this respect. As discussed in earlier posts, most of the extra heat caused by people's emissions goes into the oceans.

The great ocean conveyor belt (Thermohaline Circulation), brings warm water from the southern hemisphere to the northern hemisphere.

The Gulf Stream is the North Atlantic leg of the great ocean conveyor belt, and it brings dense, salty water from the North Atlantic into the Arctic Ocean.

Saltier water is denser than fresher water because the dissolved salts fill interstices between water molecules, resulting in more mass per unit volume.

Very dense ocean water can be found in the North Atlantic because the North Atlantic has high salinity, due to high evaporation rates, while salty water is also coming from the Mediterranean Sea.

As also discussed in an earlier post, this dense, saltier water sinks in the North Atlantic, accumulating in deeper water.

By contrast, much of the Arctic Ocean has low salinity, due to ice melt and river runoff.  As it enters the Arctic Ocean, the warm and dense water from the Atlantic thus dives under the under the sea ice and under the less salty surface water in the Arctic Ocean.

In conclusion, much of the heat resulting from people's emissions accumulates in the North Atlantic and also ends up in the Arctic. This partly explains why surface temperatures are rising much faster at the poles, as illustrated by the NOAA image below.


There are further reasons why surface air temperatures elsewhere (other than at the poles) are rising less rapidly than they did, say, a decade ago. As also discussed by Andrew Glikson in the post No Planet B, the increased amounts of sulphur emitted by the growing number of coal-fired power plants and by the burning of bunker fuel on sea is (temporarily) masking the full wrath of global warming.

Another reason is the growth of the sea ice around Antarctica, as illustrated by the CryosphereToday image on the left.

Melting takes place both in the Arctic and on Antarctica, but more so in the Arctic. Recent research of CryoSat-2 data reveals that Greenland alone is now losing about 375 cubic kilometers of ice annually, while in Antarctica the annual volume loss now is about 125 cubic kilometers.

Currents also distribute ocean heat in ways that make the Arctic warm up more than twice as rapidly as the Antarctic. In a recent paper, John Marshall et al. further suggest that ozone depletion also contributes to this.

All this makes that, while the jet streams on the northern hemisphere are circumnavigating the globe at a slower pace, jet streams on the southern hemisphere are getting stronger, making it more difficult for warm air to enter the atmosphere over Antarctica, while the stronger winds also speed up sea currents on the southern hemisphere. This makes the sea ice around Antarctica grow, and as the sea ice spreads further away from Antarctica, temperatures of surface waters around Antarctica are falling.

Growth of the sea ice around Antarctica makes that more sunlight is reflected back into space. There now is some 1.5 million square kilometers more sea ice around Antarctica than there used to be. The albedo change associated with sea ice growth on the southern hemisphere can be estimated at 1.7 W/sq m, i.e. more than the total RF of all CO2 emission caused by people from 1750 to 2011 (IPCC AR5).


The rapid growth of sea ice on the southern hemisphere alone goes a long way to explain why, over the past three months, surface air temperatures have not been much higher than they used to be, both globally and in the Arctic, as illustrated by above NOAA image. What has also contributed to warmer temperatures around latitude 60 on the northern hemisphere is the fact that methane has accumulated in the atmosphere at that latitude, as discussed in earlier posts.

Arctic SST far exceed anything ever seen in human history
So, does the sea ice on the southern hemisphere constitute a negative feedback that could hold back global warming? It doesn't.

It may temporarily keep surface temperatures close to what they used to be, as the sea ice reflects lots of sunlight back into space, but at the same time ocean temperatures are rising strongly, as the sea ice also prevents heat from radiating out of the waters around Antarctica.

The latter also helps explaining the colder surface temperatures over those waters.

Much of this additional ocean heat has meanwhile been transported by the great ocean conveyor belt to the northern hemisphere.

No time before in human history has such a huge amount of ocean heat accumulated in the North Atlantic and the North Pacific. This heat is now threatening to invade the Arctic Ocean and trigger huge temperature rises due to methane eruptions from the seafloor.


The situation is dire and calls for comprehensive and effective action, as dicussed at the Climate Plan blog.