Friday, October 28, 2016

Arctic sea ice extent again at record low for time of year

For some time, Arctic sea ice extent has again been at a record low for the time of the year. The image below shows Arctic sea ice extent on October 26, 2016, when extent was only 6.801 million km².


One reason for the low sea ice extent is the high and rising temperature of the Arctic Ocean. On October 27, 2016, the Arctic Ocean was as warm as 14.8°C or 58.6°F (green circle near Svalbard), 12.1°C or 21.7°F warmer than 1981-2011, as the image below shows.


On October 29, 2016, the Arctic Ocean was as warm as 14.9°C or 58.8°F (green circle near Svalbard), 12.1°C or 21.8°F warmer than 1981-2011, as the image below shows.


As the sea ice shrinks, less sunlight gets reflected back into space, while more open water and higher sea surface temperatures also cause storms and cyclones to become stronger. Stronger cyclones also cause greater amounts of water vapor to move up the Pacific Ocean and the Atlantic Ocean toward the Arctic.

[ click on image to enlarge ]
[ click on image to enlarge ]
Less Arctic sea ice and a warmer Arctic Ocean make that more heat and water vapor gets transferred from the Arctic Ocean to the atmosphere. The two above images show temperature forecasts for November 1 & 2, 2016. In both cases, temperatures over the Arctic as a whole are forecast to be as much as 6.40°C higher than 1979-2000.

As these images show, temperature anomalies in many places are at the top end of the scale, i.e. +20°C or +36°F.


Above combination image shows record low Arctic sea ice for the time of the year (left) and near record low Antarctic sea ice for the time of the year (right), with a combined sea ice extent of only 23.751 million km² on October 28, 2016. In other words, the world is now absorbing a lot of sunlight that was previously reflected back into space.

Below are two further temperature forecast:

Above image shows forecasts for October 31, 2016. The Arctic is forecast to be 6.07°C warmer than 1979-2000, while the Antarctic is forecast to be 4.56°C warmer than 1979-2000.

Above image shows forecasts for November 1, 2016. The Arctic is forecast to be 6.42°C warer than 1979-2000, while the Antarctic is forecast to be 3.70°C warmer than 1979-2000.

Rising temperatures over the Arctic further contribute to a rise in the amount of water vapor in the air over the Arctic at a rate of 7% more water vapor for every 1°C warming. Since water vapor is a potent greenhouse gas, more water vapor further accelerates warming in the Arctic.

The Climate Reanalyzer image below shows the temperature rise in the Arctic over time.


In the video below, Dr. Walt Meier of NASA Goddard Space Flight Center describes how the Arctic has been losing its thicker and older sea ice over the years (1991 to September 2016).


The Naval Research Lab 30-day thickness animation below (up to October 28, 2016, with forecasts up to November 5, 2016) further shows minimal recent growth of the Arctic sea ice, especially in terms of the ice with a thickness of 1m or above.


As the Arctic Ocean gets warmer, the danger grows that large amounts of methane will erupt from destabilizing hydrates at its seafloor. Ominously, high methane levels are visible over the Arctic on the image below, showing methane levels as high as 2424 ppb on October 24, 2016.

The animation below, made with images from another satellite (and a different scale), shows high methane levels over th Arctic Ocean from October 26 to 28, 2016.


The situation is dire and calls for comprehensive and effective action, as described in the Climate Plan.


Monday, October 17, 2016

Pursuing efforts?

Late last year at the Paris Agreement, nations pledged to hold the global average temperature rise to well below 2°C above pre-industrial levels and to pursue efforts to limit the temperature rise to 1.5°C above pre-industrial levels. On 5 October 2016, the threshold for entry into force of the Paris Agreement was achieved. The Paris Agreement will formally enter into force on 4 November 2016.


Meanwhile, as illustrated by above image, temperatures have been more than 1.5°C above pre-industrial levels for nine out of the past twelve months. For the months February and March 2016, the anomaly was actually quite close to the 2°C guardrail, while for station-only measurements, warming for February and March 2016 was well over the 2°C guardrail from pre-industrial levels.

The monthly warming in above image was calculated by using the NASA Global Monthly Mean Surface Temperature Change data (Land+Ocean) from 1880 through to September 2016, while adding 0.28°C to cater for the rise from 1900 to 1951-1980, and additionally adding 0.3°C to cater for the rise from pre-industrial to 1900.

[ click on image to enlarge ]
The 0.28°C adjustment (to cater for the rise from 1900 to 1951-1980) is illustrated by above graph, which has a polynomial trend added to the NASA Global Monthly Mean Surface Temperature Change (Land+Ocean) data from January 1880 through to September 2016.

As said, the top image has a further 0.3°C added to cater for the rise from pre-industrial to 1900, as discussed in an earlier post.


Above image shows sea surface temperature anomalies on the Northern Hemisphere, with a polynomial trend pointing at a doubling of ocean warming within one decade. Warming of the sea surface on the Northern Hemisphere threatens to speed up Arctic sea ice loss, as the Gulf Stream pushes ever warmer water toward the Arctic Ocean.


In addition, warming of the air over the Arctic Ocean occurs faster than elsewhere on Earth, as illustrated by above image and by the animation on the right.

This further speeds up the demise of the snow and ice cover, as illustrated by the images below.

Arctic sea ice extent on October 20, 2016, was at a record low for the time of the year, at only 6.15 million square km, as measured by the National Institute of Polar Research in Japan.


The images below show Arctic sea ice extent as measured by NSIDC.org (left) and average Arctic sea ice extent (year to date, October 20, 2016), from a post by Torstein Viðdalr (right).

Average Arctic sea ice extent for the period October 22, 2015 to October 20, 2016 (blue line) was lower than it was for any other 365-day period since 1978, when satellites first started measuring sea ice extent.


The images below show Arctic sea ice thickness as measured by the National Institute of Polar Research in Japan (left) and as measured by the Naval Research Laboratory (right, new model).

[ click on image to enlarge ]

Albert Kallio comments (in italics):
ARCTIC OCEAN SEA ICE GROWTH STOPS DUE TO HEAT BARRIER
The rapid growth of the sea ice has stopped because during the summer the surrounding ocean accumulated so much heat that it cannot yet freeze. Whilst the central Arctic Ocean around the North Pole saw a very rapid freezing as its broken sea ice cover quickly fused together in cold, autumn darkness breaking new records, it now has suddenly hit the opposite: a new all time record low for sea ice area for this time of season. This is because the ocean is still too warm for water to freeze around edges of the Arctic Ocean leading to all-time record low ice area that fell below or is at least in par with year 2012 low (the last record low ice year).


The image below (Arctic on the left, Antarctic on the right) was created by Daniel Kieve.
Daniel Kieve comments (in italics):
Both Arctic and Antarctic sea ice are now at record low extent for this time of year according to NSIDC data, with the Arctic sea ice over 2 million square kilometres lower than the average extent for 20th October. The Antarctic sea ice is at 2 standard deviations below the (30 year) average. At this time of year it's usually a time of rapid ice growth in the Arctic but it's stalled due to the continuance of anomalously warm air in parts of the Arctic and in particular the record warmth in the oceans that is encroaching more and more into the Arctic. This means next Summer the Arctic ice is more vulnerable than ever to collapse as the insolation reaches its peak in June and July.

Demise of the snow and ice cover in the Arctic further accelerates warming of the Arctic Ocean in a number of ways. Decline of sea ice extent makes that less sunlight gets reflected back into space and instead gets absorbed by the Arctic Ocean. Similarly, the decline of the snow and ice cover on land in the Arctic makes that more sunlight gets absorbed on land, which in turn make that warmer water from rivers flows into the Arctic Ocean. For more feedbacks, see the feedbacks page.

There's a growing danger is that further warming of the Arctic Ocean will trigger huge eruptions of methane from its seafloor. Ominously, on October 20, 2016, methane levels were as high as 2559 parts per billion, as illustrated by the image below, which also shows high methane levels over large parts of the Arctic Ocean.

The temperature rise resulting from such feedbacks has the potential to cause in mass extinctions (including humans) and destruction over the coming decade, as discussed at the extinction page.

The situation is dire and calls for comprehensive and effective action as described in the Climate Plan.


Links

 Climate Plan
http://arctic-news.blogspot.com/p/climateplan.html

 How Much Warming Have Humans Caused?
http://arctic-news.blogspot.com/2016/05/how-much-warming-have-humans-caused.html

 NASA GISS Surface Temperature Analysis (GISTEMP)
http://data.giss.nasa.gov/gistemp

 81 Parties have ratified of 197 Parties to the Convention
http://unfccc.int/paris_agreement/items/9485.php

 Paris Agreement
http://unfccc.int/resource/docs/2015/cop21/eng/10a01.pdf


Monday, October 10, 2016

Blue Ocean Event September 2017?

Will there be a Blue Ocean Event in September 2017, during which the Arctic Ocean will be virtually ice-free? What would be the significance of such an event?

The Arctic Ocean is about to become virtually ice-free, perhaps as early as next year. At first, this Blue Ocean Event may last for one or more days in September 2017. Over the years, the ice-free period will grow longer and longer, if no action is taken.

Projections of an ice-free Arctic Ocean have been made for years. What makes the prospect of a Blue Ocean Event so dire?

Disappearance of the sea ice means that a huge amount of sunlight that was previously reflected back into space, is instead getting absorbed by the Arctic. The reason for this is that sea ice is more reflective than the water of the Arctic Ocean. The situation on land in the Arctic is similar, i.e. the snow and ice cover on land is more reflective than the darker soil and rocks that get uncovered as the snow and ice disappears. So, extra heat gets added and this is accelerating warming in the Arctic. On land, extra heat will also warm up water of rivers, and a lot of this heat will end up in the Arctic Ocean.

Another feedback is water vapor, as highlighted in the diagram below.


A warmer atmosphere carries more water vapor. Since water vapor is a potent greenhouse gas, this further accelerates warming over the Arctic.


As above image shows, temperatures have been more than 2.5°C warmer than 1981-2010 over most of the Arctic Ocean over the past 365 days (up to October 7, 2016). Accelerated Arctic warming has been taking place for a long time. So, what is it that makes a Blue Ocean Event, a virtually ice-free Arctic Ocean, such a big thing?

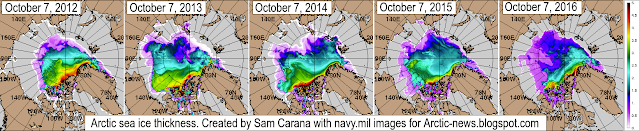
It is a huge event, because once the sea ice is gone, warming of the Arctic Ocean is likely to speed up even more dramatically. Why? Because having no more sea ice means that the buffer is gone. In the past, thick sea ice extended meters below the sea surface, in many parts of the Arctic Ocean. Melting of this ice into water did consume massive amounts of ocean heat. As such, thick sea ice acted as a buffer. Over the years, Arctic sea ice has become thinner and thinner, as illustrated by the image below.

[ click on image to enlarge ]
Over the past few years, trends have been pointing at zero thickness soon, i.e. in a matter of years. Added below is a trend produced by Arctische Pinguin, pointing at zero volume sea ice in the year 2021.
[ click on image to enlarge ]
Note that there is some variability from year to year. This indicates that a Blue Ocean Event may well happen earlier than the trend, e.g. in September 2017. The image further shows that there's hardly any buffer left, the buffer is virtually gone!

This buffer used to consume massive amounts of ocean heat that is carried along sea currents into the Arctic Ocean. Once the sea ice is gone, that heat must go somewhere else. A huge amount of energy used to be absorbed by this buffer, i.e. by melting ice and transforming it into water. The energy that used to be absorbed by melting ice is as much as it takes to warm up an equivalent mass of water from zero °C to 80 °C. Much of this heat will then suddenly speed up warming of the water of the Arctic Ocean, rather than going into melting the ice as it did previously. So, the water of the Arctic Ocean will suddenly warm up dramatically. Remember that the Arctic Ocean in many areas is very shallow, in many places it's less than 50 m deep, as discussed in an earlier post.

The Buffer has gone, feedback #14 on the Feedbacks page
The danger is that this extra heat will reach the seafloor and destabilize methane hydrates that are contained in sediments at the bottom of the Arctic Ocean. This could result in huge methane eruptions. It is hard for methane plumes to get broken down in the water, given the abrupt and concentrated nature of such releases and given that the Arctic Ocean is in so many places very shallow. Once that methane enters the atmosphere, it will strongly contribute to further warming of the atmosphere over the Arctic.


In conclusion, disappearance of the sea ice would mean that the buffer has gone. This further increases the danger of huge abrupt releases of methane from the seafloor of the Arctic Ocean. In many respects, the danger is such that we can just count ourselves lucky that such huge releases haven't occurred yet.

In response to this danger, comprehensive and effective action is needed, along multiple lines of action, each implemented in parallel and simultaneously. While local feebates are typically the most effective policies, local communities can each decide what works best for them, provided that agreed targets are met, and such targets will need to be a lot stronger and more comprehensive than the aspirational emission reductions that countries have submitted as part of the Paris Agreement.

The situation is dire and calls for comprehensive and effective action, as described in the Climate Plan.


Above post was also read by David Petraitis as part of the podcast by Wolfgang Werminghausen