Showing posts with label earthquake. Show all posts

Monday, October 19, 2020

Earthquake hits Alaska October 19, 2020


An earthquake with a magnitude of 7.5 on the Richter scale hit Alaska (blue circle on map) on October 19, 2020 8:54 pm UTC.

The image shows a screenshot taken October 19, 2020 11:30 pm UTC featuring earthquakes over the past 7 days, with the M7.5 earthquake showing up in blue and the other earthquakes colored by age, i.e. hour (red), day (orange) and week (yellow). 

Such huge earthquakes can cause tsunamis.

In the Arctic, such huge earthquakes also come with the danger that they will destabilize methane hydrates at the seafloor which can cause huge amounts of methane to erupt. Shockwaves can travel along faults and cause eruptions at places far away from where the original eathquake occurred. 

Ominously, the MetOp-1 satellite recorded methane levels as high as 2618 ppb on the morning of October 22, 2020 at 586 mb. 


On the afternoon of October 23, 2020, the SNPP satellite recorded methane levels as high as 2735 ppb at 487.2 mb. 


The situation is dire and calls for immediate, comprehensive and effective action, as described in the Climate Plan.


Links

• USGS - M 7.5 - 91 km SE of Sand Point, Alaska - 2020-10-19 20:54:40 (UTC)
https://earthquake.usgs.gov/earthquakes/eventpage/us6000c9hg/executive

• USGS - Earthquakes map
https://earthquake.usgs.gov/earthquakes/map

• Seismic Events
https://arctic-news.blogspot.com/p/seismic-events.html

• Climate Plan
https://arctic-news.blogspot.com/p/climateplan.html

Tuesday, March 17, 2020

Methane, Earthquake and Sudden Stratospheric Warming


On the morning of March 12, 2020, peak methane levels were as high as 2902 ppb (parts per billion) at a pressure level of 469 mb (millibar, equivalent to an altitude of some 6 km (almost 20,000 feet).

What did cause this very high peak? The image on the right shows the situation at 695 mb.

High levels of methane, colored in magenta, show up over the oceans at high latitudes north, especially around Greenland and around Svalbard.

The image underneath on the right shows methane even closer to sea level, at 1000 mb. At this altitude, such magenta-colored high levels of methane only show up over an area in between Greenland and Svalbard.

It appears that these high methane levels did originate from this area. What could have triggered this?

The image below shows that an earthquake with a magnitude of 4.6 on the Richter scale hit an area in between Greenland and Svalbard on March 11, 2020, at 21:30:03 (UTC), 2020, at depth of 10 km.


It appears that the earthquake did cause destabilization of sediments at the seafloor of the Arctic Ocean in between Greenland and Svalbard, containing methane in the form of hydrates and free gas, with the destabilization resulting in the eruption of methane that subsequently reached the atmosphere.

As illustrated by the image on the right, there were strong differences in pressure in the atmosphere over Greenland on the one hand and over the Arctic Ocean on the other hand, on March 11, 2020, 21:00 UTC.

The next question is if there was something that triggered the earthquake. The image below shows a forecast for March 22, 2020, of conditions in the stratosphere at 10 hPa.


Above image shows a forecast for March 22, 2020, of temperatures as high as 6.2°C or 43.2°F and as low as -68.8°C or -91.9°F at another location at 10 hPa (Polar Vortex), with wind reaching speeds as high as 369 km/h or 229 mph.

The image on the right shows a huge temperature difference between two locations in the stratosphere on March 23, 2020, resulting in wind reaching speeds as high as 341 km/h or 212 mph.

This indicates a strong updraft, carrying huge amounts of relatively warm air from low altitudes over the Arctic up into the stratosphere.

Following a steep fall, Arctic sea ice extent was at a record low for the time of year on March 28, 2020, as illustrated by the image below.
Since the start of 2020, Arctic sea ice volume has been at a record low for the time of year, as the image on the right shows.

These conditions may have acted as a sink plunger, triggering the earthquake and destabilizing sediments at the seafloor, resulting in the methane eruptions.

More generally, the events reflect a huge and growing overall imbalance in the temperature of the atmosphere, and the added methane releases further contribute to this imbalance.

Meanwhile, sea surface temperatures off the coast of North America on March 21, 2020, were as much as 13.2°C or 23.7°F higher than 1981-2011 (at the green circle on the image on the right).

With sea ice thickness this low, it looks like there will be no buffer left to consume ocean heat that gets carried along the path of the Gulf Stream into the Arctic Ocean, which threatens to further destabilize sediments containing huge amounts of methane, as also discussed in an earlier post.

On top of this, high temperatures keep showing up over the Arctic Ocean in forecasts, as illustrated by the two forecasts below (for March 21, 2020, and for March 31, 2020).

Temperature anomaly forecast for March 21, 2020
Temperature anomaly forecast for March 31, 2020

Discussion


As said above, it appears that this M4.6 earthquake on March 11, 2020, caused destabilization of sediments at the seafloor of the Arctic Ocean in between Greenland and Svalbard.

The image on the right shows that earlier, a M5 earthquake hit an area a bit to the north, i.e. on March 3, 2020.

While not much methane showed up locally following that M5 earthquake, high methane readings were recorded elsewhere over large parts of the Arctic Ocean early March 2020, which could have resulted from destabilization along the fault line that crosses the Arctic Ocean (red line).

The next image on the right shows that earthquakes between Greenland and Svalbard over the past decade did predominantly occur on this fault line.

The high methane readings in between Greenland and Svalbard following the M4.6 earthquake could have occurred for the very reason that this earthquake hit an area outside the fault line, where sediments had until now rarely been shaken.

This could imply there could be huge amounts of methane contained in areas outside the fault line, supporting the above warning that ocean heat that gets carried along the path of the Gulf Stream into the Arctic Ocean threatens to further destabilize sediments containing huge amounts of methane. After all, such destabilization can occur as a result of higher temperatures or changes in pressure, or both.

Update

South Greenland was hit by M4.3 and M4.5 earthquakes on April 17, 2020. North Greenland was earlier hit by a M4.6 earthquake, on March 30, 2020.


Earthquakes that hit the Greenland mainland are rare. Earthquakes typically take place on or close to the faultline (red line) that goes over Iceland and extends north, running in between Greenland and Svalbard, as was the case with the M4.2 east of Greenland on April 2, 2020.

This faultline runs across the seafloor of the Arctic Ocean all the way to Russia. Multiple earthquakes hit this faultline recently, including two M4.3 eartquakes, one east of Severnaya Zemlya on April 12, 2020, and one near Tiksi on March 27, 2020.


The situation is dire and calls for immediate, comprehensive and effective action, as described in the Climate Plan.


Links

• Arctic Ocean January 2020
https://arctic-news.blogspot.com/2020/02/arctic-ocean-february-2020.html

• Seismic Events
https://arctic-news.blogspot.com/p/seismic-events.html

• Arctic Ocean February 2020
https://arctic-news.blogspot.com/2020/02/arctic-ocean-february-2020.html

• Climate Plan
https://arctic-news.blogspot.com/p/climateplan.html


Monday, January 9, 2017

Canadian Arctic Archipelago Hit By M5.8 Earthquake

An earthquake with a magnitude of 5.8 on the Richter scale hit the Canadian Arctic Archipelago on January 8, 2017.


Above image was created with USGS (United States Geological Survey) content. The image shows the epicenter of the quake (gold star). The earthquake hit Barrow Strait on January 8, 2017 at 23:47:12 (UTC), at 74.320°N - 92.305°W and at a depth of 18.9 km.

Another earthquake hit Barrow Strait on January 9, 2017, this time with a magnitude of 5.2 on the Richter scale, within a day of the earlier M5.8 quake (both in orange on map below). These two earthquakes are among the largest quakes to hit the area in the past five years (map area shows all M1+ quakes since January 9, 2012).


These earthquakes are important, given their magnitude and given that they hit an area without large faultlines (though earthquakes are not uncommon here, also see this discussion). Importantly, these earthquakes occurred in an area prone to glacial isostatic adjustment, as illustrated by the image below.

From "http://grace.jpl.nasa.gov", (unfiltered version). Credit: A, G., J. Wahr, and S. Zhong (2013) "Computations
of the viscoelastic response of a 3-D compressible Earth to surface loading: an application to Glacial Isostatic
Adjustment in Antarctica and Canada", Geophys. J. Int., 192, 557–572, doi: 10.1093/gji/ggs030

Glacial isostatic adjustment as a phenomenon typically takes place over relatively long periods. Yet, extreme weather events can trigger earthquakes in areas that are already on the edge.

The extreme weather situation is depicted by the combination image below.


Similar to the M4.6 earthquake that hit Baffin Island on February 12, 2015, this earthquake occurred at a time when surface temperature anomalies over parts of North America and Greenland were at the bottom end of the scale. At the same time, temperature anomalies over the Arctic Ocean are at the top end of the scale, as illustrated by the left panel in above image. The right panel in above image shows pressure differences reaching the top and bottom ends of the scale.

Earthquakes in the Arctic Ocean are dangerous as they can destabilize methane hydrates. Huge amounts of methane are present in sediments under the Arctic Ocean in the form of free gas and hydrates. Earthquakes can send out strong tremors through the sediment and shockwaves through the water, which can trigger further earthquakes, landslides and destabilization of methane hydrates. The situation is especially dangerous when combined with extreme weather events that can cause cracks and movement in sediments.


Above map, from an earlier post, shows the location of fault lines on the Northern Hemisphere.

The combination image below shows methane levels on January 9, 2017, am, at two different altitudes.

[ click on images to enlarge ]

As temperatures in the Arctic Ocean keep rising, the jet streams and polar vortex are changing their shapes. The North Polar Jet Stream becomes more wavy, and this makes that more extreme weather events can happen such as the events described above.

The situation is dire and calls for comprehensive and effective action, as described at the Climate Plan.


Links

• Climate Plan
http://arctic-news.blogspot.com/p/climateplan.html

• Seafloor Methane
http://arctic-news.blogspot.com/2016/12/seafloor-methane.html

• High Methane Levels Follow Earthquake in Arctic Ocean
http://arctic-news.blogspot.com/2016/07/high-methane-levels-follow-earthquake-in-arctic-ocean.html

• Something had to give - Baffin Island hit by M4.6 earthquake
http://arctic-news.blogspot.com/2015/02/something-had-to-give-baffin-island-hit-by-m4.6-earthquake.html

• Ring Of Ice
http://arctic-news.blogspot.com/2014/08/ring-of-ice.html

• High Methane Levels over Laptev Sea
http://arctic-news.blogspot.com/2013/10/high-methane-levels-over-laptev-sea.html

• Methane Release caused by Earthquakes
http://arctic-news.blogspot.com/2013/09/methane-release-caused-by-earthquakes.html

• Sea of Okhotsk
http://methane-hydrates.blogspot.com/2013/06/sea-of-okhotsk.html


Sunday, July 17, 2016

High Methane Levels Follow Earthquake in Arctic Ocean

In the 12 months up to July 14, 2016, 48 earthquakes with a magnitude of 4 or higher on the Richter scale hit the map area of the image below, mostly at a depth of 10 km (6.214 miles).


As temperatures keep rising and as melting of glaciers keeps taking away weight from the surface of Greenland, isostatic rebound can increasingly trigger earthquakes around Greenland, and in particular on the faultline that crosses the Arctic Ocean.

Two earthquakes recently hit the Arctic Ocean. One earthquake hit with a magnitude of 4.5 on the Richter scale on July 9, 2016. The other earthquake hit with a magnitude of 4.7 on the Richter scale on July 12, 2016, at 00:15:24 UTC, with the epicenter at 81.626°N 2.315°W and at a depth of 10.0 km (6.214 miles), as illustrated by the image below.


Following that most recent earthquake, high levels of methane showed up in the atmosphere on July 15, 2016, over that very area where the earthquake hit, as illustrated by the image below.


Above image shows that methane levels were as high as 2505 ppb at an altitude of 4,116 m or 13,504 ft on the morning of July 15, 2016. At a higher altitude (of 6,041 m or 19,820 ft), methane levels as high as 2598 ppb were recorded that morning and the magenta-colored area east of the north-east point of Greenland (inset) looks much the same on the images in between those altitudes. All this indicates that the earthquake did cause destabilization of methane hydrates contained in sediments in that area.

Above image, from another satellite, confirms strong methane releases east of Greenland on the afternoon of July 14, 2016, while the image below shows high methane levels on July 16, 2016, along the faultline that crosses the Arctic Ocean.


The image on the right shows glaciers on Greenland and sea ice near Greenland and Svalbard on July 15, 2016. Note that clouds partly obscure the extent of the sea ice decline.


Above image shows the sea ice on July 12, 2016. There is a large area with very little sea ice close to the North Pole (left) and there is little or no sea ice around Franz Josef Land (right). Overall, sea ice looks slushy and fractured into tiny thin pieces. All this is an indication how warm the water is underneath the sea ice.

[ click on image to enlarge ]
In addition to the shocks and pressure changes caused by earthquakes, methane hydrate destabilization can be triggered by ocean heat reaching the seafloor of the Arctic Ocean. Once methane reaches the atmosphere, it can very rapidly raise local temperatures, further aggravating the situation.

Temperatures are already very high across the Arctic, as illustrated by the image below, showing that on July 16, 2016, it was 1.6°C or 34.8°F over the North Pole (top green circle), while it was 32.7°C or 90.8°F at a location close to where the Mackenzie River flows into the Arctic Ocean (bottom green circle).

Arctic sea ice is in a very bad shape, as also illustrated by the Naval Research Laboratory nowcast below.


Sea ice thickness has fallen dramatically over the years, especially the ice that was more than 2.5 m thick. The image below compares the Arctic sea ice thickness (in m) on July 15, for the years from 2012 (left panel) to 2015 (right panel), using Naval Research Laboratory images.

[ Click on image to enlarge ]
The image below shows sea surface temperature anomalies from 1961-1990 on July 24, 2016.


Sea surface temperatures off the coast of America are high and much of this ocean heat will be carried by the Gulf Stream toward the Arctic Ocean over the next few months.


On July 24, 2016, sea surface temperature near Florida was as high as 33.2°C or 91.7°F, an anomaly of 3.7°C or 6.6°F from 1981-2011 (bottom green circle), while sea surface temperature near Svalbard was as high as 17.3°C or 63.2°F, an anomaly of 12.6°C or 22.8°F from 1981-2011 (top green circle).

A cold freshwater (i.e. low salinity) lid sits on top of the ocean and this lid is fed by precipitation (rain, hail, snow, etc.), melting sea ice (and icebergs) and water running off the land (from rivers and melting glaciers on land). This lid reduces heat transfer from ocean to atmosphere, and thus contributes to a warmer North Atlantic where huge amounts of heat are now carried underneath this lid toward the Arctic Ocean. The danger is that more ocean heat arriving in the Arctic Ocean will destabilize clathrates at the seafloor and result in huge methane eruptions, as discussed in earlier posts such as this one.

As temperatures keep rising, snow and ice in the Arctic will decline. This could result in some 1.6°C or 2.88°F of warming due to albedo changes (i.e. due to decline both of Arctic sea ice and of snow and ice cover on land). Additionally, some 1.1°C or 2°F of warming could result from methane releases from clathrates at the seafloor of the world's oceans. As discussed in an earlier post, this could eventuate as part of a rise from pre-industrial levels of as much as 10°C or 18°F, by the year 2026.

[ click on image to enlarge ]


The impact of rising temperatures will be felt firstly and most strongly in the Arctic, where global warming is accelerating due to numerous feedbacks that can act as self-reinforcing cycles.

Already now, this is sparking wildfires across the Arctic.

Above image shows wildfires (indicated by the red dots) in Alaska and north Canada, on July 15, 2016.

The image on the right shows smoke arising from wildfires on Siberia. The image below shows that, on July 18, 2016, levels of carbon monoxide (CO) over Siberia were as high as 32318 ppb, and in an area with carbon dioxide (CO2) levels as low as 345 ppm, CO2 reached levels as high as 650 ppm on that day.

[ click on images to enlarge them ]
The image below shows the extent of smoke from wildfires in Siberia on July 23, 2016.


The image below shows high methane levels over Siberia on July 19, 2016.


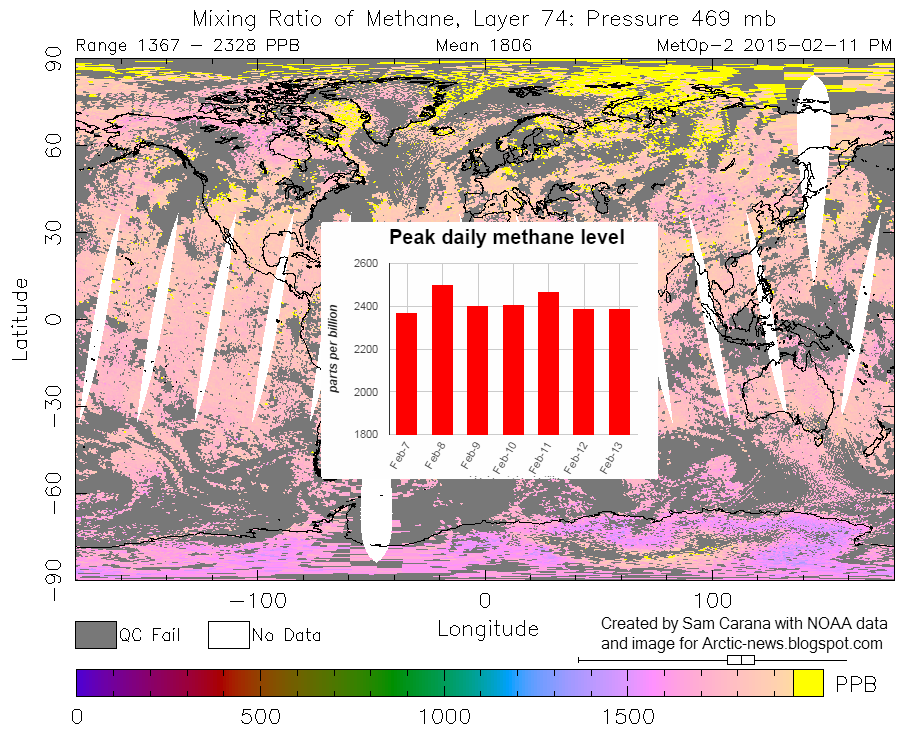
The image below, from the MetOp satellite, shows high methane levels over Siberia on July 21, 2016.

Below are further images depicting mean global methane levels, from 1980-2016 (left) and 2012-2016 (right).

The image below shows methane levels at Barrow, Alaska.


The image below shows that, while methane levels may appear to have remained stable over the past year when taking measurements at ground level, at higher altitudes they have risen strongly.


The conversion table below shows the altitude equivalents in feet, m and mb.
57016 feet44690 feet36850 feet30570 feet25544 feet19820 feet14385 feet 8368 feet1916 feet
17378 m13621 m11232 m 9318 m 7786 m 6041 m 4384 m 2551 m 584 m
 74 mb 147 mb 218 mb 293 mb 367 mb 469 mb 586 mb 742 mb 945 mb

The situation is dire and calls for comprehensive and effective action, as described at the Climate Plan.


Thursday, February 12, 2015

Something had to give - Baffin Island hit by M4.6 earthquake

An earthquake with a magnitude of 4.6 on the Richter scale hit Baffin Island on February 12, 2015, at 02:11:40 (UTC). The image below, from the United States Geological Survey (USGS), shows the epicenter of the quake.


The earthquake occurred at a time when surface temperature anomalies over parts of North America and Greenland are at the bottom end of the scale, while surface temperature anomalies over parts of Siberia are at the top end of the scale, as illustrated by the image below.


The image below shows pressure differences reaching the top and bottom ends of the scale (left). At the same time, sea surface temperature anomalies around North America and Greenland are at the top end of the scale (right). It appears that something had to give. 


This earthquake is important, given that it hit an area without large faultlines (though earthquakes are common here, also see this discussion). The Baffin Island earthquake occurred in an area prone to glacial isostatic adjustment, as illustrated by the image below.

From "http://grace.jpl.nasa.gov", (unfiltered version). Credit: A, G., J. Wahr, and S. Zhong (2013) "Computations
of the viscoelastic response of a 3-D compressible Earth to surface loading: an application to Glacial Isostatic
Adjustment in Antarctica and Canada", Geophys. J. Int., 192, 557–572, doi: 10.1093/gji/ggs030
Glacial isostatic adjustment as a phenomenon takes place over relatively long periods. An additional problem is extreme weather events influencing the occurence of earthquakes more immediately.

Here's an update on the situation. Five earthquakes occured on February 13, 2015, close together, including a magnitude 7.1 at the Northern Mid-Atlantic Ridge, south of Greenland:
- M5.3 Northern Mid-Atlantic Ridge 2015-02-13 18:48:16 UTC 10.0 km
- M4.9 Northern Mid-Atlantic Ridge 2015-02-13 18:58:06 UTC 10.0 km
- M7.1 Northern Mid-Atlantic Ridge 2015-02-13 18:59:12 UTC 13.8 km
- M4.7 Reykjanes Ridge 2015-02-13 21:25:18 UTC 10.0 km
- M5.2 Reykjanes Ridge 2015-02-13 19:33:10 UTC 14.2 km

This M7.1 is the largest earthquake to hit the area around Greenland in a decade or more. And it's not just this one that has recently hit the area. The image below shows the recent Baffin Island quake in yellow, and the earthquakes that occurred today at the Northern Mid-Atlantic Ridge in orange. Furthermore, there are recent quakes on Iceland in orange and yellow. There were also three large earthquakes in the Greenland Sea, the 4.6 one is highlighted in blue (otherwise it would have been hidden).


The image below gives an impression of extreme weather events on February 13-14, 2015. 


Boston has meanwhile run out of room to dump snow, while roofs have collapsed in Massachusetts under the weight of the snow. Lnks between extreme weather events and earthquakes have been discussed before. Extreme weather events look set to intensify as temperatures in the Arctic keep rising. This is very worrying, given the vulnerability of methane under the seafloor of the Arctic Ocean. Furthermore, there are also indications that methane could be released from Greenland due to sequences of strong compaction and expansion of the snow and ice cover, due to extreme weather events. 

High methane levels have recently been recorded in the atmosphere over the Arctic Ocean, including over Baffin Bay.


Methane is present in sediments under the Arctic Ocean in the form of free gas and hydrates. Earthquakes can send out strong tremors through the sediment and shockwaves through the water, which can trigger further earthquakes, landslides and destabilization of methane hydrates.

As temperatures in the Arctic keep rising, the jet streams and polar vortex are changing their shape, in particular becoming more wavy, which can cause more extreme weather events such as the events described above.

The situation is dire and calls for comprehensive and effective action, as discussed at the Climate Plan blog