Showing posts with label tipping points. Show all posts

Friday, January 19, 2024

Potential temperature trends

[ click on images to enlarge ]

The above image shows potential temperature trends. Four of the trends are global ones and one trend is based on Arctic (64°North-90°North) data:

  • The red line is a polynomial trend based on 15 years of Arctic data (2009-2023).
  • The green line is a linear trend based on 1880-2023 global data.
  • The yellow line is a linear trend based on 2009-2023 global data.
  • The light blue line is a 10-year moving average (trailing), based on global data.
  • The dark blue line is a polynomial trend, based on 2015-2023 global data, showing global temperatures catching up with the Arctic rise in temperature.

Note that the above image uses annual anomalies from 1951-1980. Recent posts show that, when adjustments are made for an earlier base, for ocean air temperatures and for higher polar anomalies, the 2023 anomaly could be as high as 2.5°C from pre-industrial and when using monthly data, the anomaly could be as high as 2.73°C from pre-industrial. 

Temperature rise hits Arctic most strongly 

Due to feedbacks such as sea ice loss, the temperature rise is felt most strongly at higher latitudes North, as illustrated by the three images below, again using a 1951-1980 baseline.

The image below shows the December 2023 temperature anomaly. 

The image below shows the 2023 temperature anomaly. 

The image below shows how the temperature rise has unfolded from 2000.  

[ Arctic Ocean hit most strongly by temperature rise ]

Over the next few years, the temperature rise in the Arctic could accelerate even more strongly as a result of crossing of two tipping points, i.e. the Latent Heat Tipping Point and the Seafloor Methane Tipping Point, as illustrated by the image below, from an earlier post.

[ increasing ocean heat ]
Note again that annual data are used in the above image. An earlier analysis using monthly data shows that the seafloor methane tipping point was reached in August 2023.

Arctic sea ice extent

Arctic sea ice extent in 2024 was larger than many expected. One of the reasons for this is that Greenland ice has been melting faster than previously thought, as pointed out by a recent study that also includes retreat of glaciers that already lie mostly below sea level. More melting of ice on Greenland has resulted in a larger south-bound flow of icebergs and meltwater, contributing to cooling of the North Atlantic sea surface and slowing down of the Atlantic meridional overturning circulation (AMOC), and in turn contributing to suppress temperatures in the Arctic. As a result, loss of Arctic sea ice extent has been less than would otherwise have been the case. Yet, the temperature rise may soon overwhelm this suppression.

Cold freshwater lid at surface of North Atlantic

[ ocean stratification, from earlier post ]

Slowing down of AMOC and cooling due to heavier melting of Greenland's ice is causing less ocean heat to reach the Arctic Ocean, while a huge amount of ocean heat is accumulating in the North Atlantic, as it did in 2023. A large part of this heat in the North Atlantic can also be present underneath the sea surface.

These developments occur at the same time as ocean stratification increases (see above image) as temperatures rise, as more freshwater enters the ocean as a result of more meltwater and of runoff from land and from rivers, and as more evaporation takes place and more rain falls further down the path of the Gulf Stream, all of which can contribute to formation and growth of a cold, freshwater lid at the surface of the North Atlantic.

[ cold freshwater lid on North Atlantic ]

Furthermore, storms can get stronger as temperatures rise and as changes take place to the Jet Stream. Strong wind can temporarily speed up currents that carry huge amounts of ocean heat with them toward the Arctic Ocean, as discussed in earlier posts such as this one. Much of the ocean heat in the North Atlantic can therefore be pushed abruptly underneath this freshwater lid and flow into the Arctic Ocean.

The danger is that huge amounts of ocean heat can abruptly get pushed into the Arctic Ocean and that the influx of ocean heat will destabilize hydrates contained in sediments at the seafloor of the Arctic Ocean, resulting in eruptions of huge amounts of methane.

[ click on images to enlarge ]

This danger is further illustrated by the above compilation image, showing forecasts for January 27, 2024 of:
(1) surface wind and temperature (-3.6°C or 25.4°F at the North Pole)
(2) surface wind
(3) wind at 700 hPa
(4) wind at 250 hPa (Jet Stream) and
(5) ocean currents at surface and wave height.

The image below shows that temperatures are forecast to be above freezing near the North Pole on January 26, 2024 20:00 UTC (downloaded January 26, 2024 06:00 UTC). 


Ominously, the North Atlantic sea surface was much hotter in early 2024 than it was in early 2023.


And ominously, the daily sea surface temperature reached a record high on January 31, 2024, when the daily sea surface temperature reached 21.10°C, higher than the peak of 21.09°C reached in August 2023 and much higher than the 20.99°C peak reached in March 2016.


As latent heat buffer shrinks, Arctic sea ice could melt away quickly

As illustrated by the image below, sea ice was very thin near the North Pole on January 24, 2024, indicating there is very little left of the latent heat buffer constituted by the sea ice to consume incoming heat. 
And even more ominously, Arctic sea ice thickness declined dramatically in a few days time, as indicated by the compilation image below, with images from the University of Bremen. 


For the time of year, Arctic sea ice extent is currently still extensive, compared to earlier years, which is a reflection of more water vapor in the atmosphere and more precipitation. While sea ice extent is relatively large, Arctic sea ice volume now is among the lowest of all years on record for the time of year, as illustrated by the image below. Volume = extent x thickness, so low volume and relatively large extent means that sea ice is very thin. 
As more sunlight starts reaching the Northern Hemisphere, in line with seasonal changes, Arctic sea ice extent can be affected dramatically and abruptly, as illustrated by the image below.

Furthermore, much of the thicker sea ice is located off the east coast of Greenland, as illustrated by the image below. This means that this sea ice is likely to melt away quickly as temperatures rise in line with seasonal changes.
Without the buffer constituted by thicker sea ice, such an influx of ocean heat could destabilize hydrates contained in sediments at the seafloor of the Arctic Ocean, resulting in eruptions of huge amounts of methane. 
[ The buffer is gone - Latent Heat Tipping Point crossed ]

Given methane's very high immediate global warming potential (GWP), this could push up temperatures dramatically and rapidly. 

[ potential methane rise, from earlier post ]

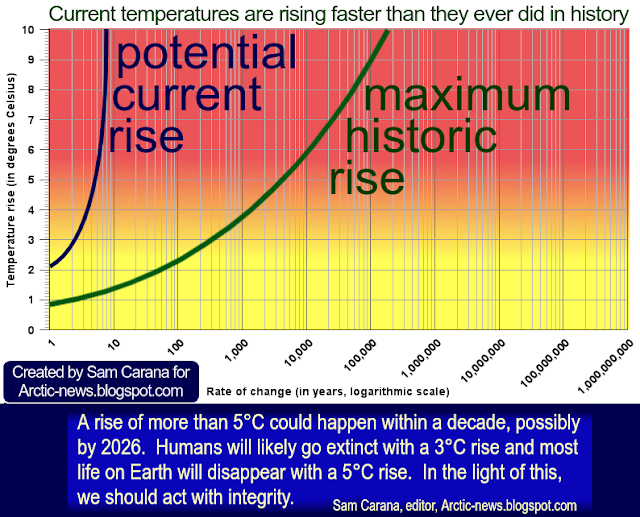
[ from the Extinction page ]
The above image shows a polynomial trend added to NOAA globally averaged marine surface monthly mean methane data from April 2018 to November 2022, pointing at 1200 ppm CO₂e (carbon dioxide equivalent) getting crossed in 2027.

A rise in methane concentrations alone may suffice to cause the Clouds Tipping Point, at 1200 ppm CO₂e, to get crossed. The resulting clouds feedback could on its own cause the temperature to rise by a further 8°C. 

When further forcing is taken into account, crossing of the Clouds Tipping Point could occur even earlier than in 2027.

The image on the right illustrates how a huge temperature could unfold and reach more than 18°C above pre-industrial by 2026.

With such a rise, the temperature is likely to keep rising further, with further water vapor accumulating in the atmosphere once the water vapor tipping point gets crossed, as discussed in an earlier post and at Could Earth go the same way as Venus? 

As a rather sobering footnote, humans will likely go extinct with a 3°C rise and most life on Earth will disappear with a 5°C rise, as illustrated by the image below, from an earlier post.
[ from earlier post ]

Climate Emergency Declaration

The situation is dire and the precautionary principle calls for rapid, comprehensive and effective action to reduce the damage and to improve the situation, as described in this 2022 post, where needed in combination with a Climate Emergency Declaration, as discussed at this group.


Links

• NASA - Goddard Institute for Space Studies (GISS) Surface Temperature Analysis
https://data.giss.nasa.gov/gistemp

• Ubiquitous acceleration in Greenland Ice Sheet calving from 1985 to 2022 - by Char Greene et al. https://www.nature.com/articles/s41586-023-06863-2
discussed at facebook at: 
https://www.facebook.com/groups/arcticnews/posts/10161223121909679

• Cold freshwater lid on North Atlantic
https://arctic-news.blogspot.com/p/cold-freshwater-lid-on-north-atlantic.html

• Latent Heat
https://arctic-news.blogspot.com/p/latent-heat.html

• Pre-industrial
https://arctic-news.blogspot.com/p/pre-industrial.html

• Could Earth go the same way as Venus?

Sunday, September 24, 2023

September 2023, highest anomaly on record?


The above image shows the temperature in 2023 as a bold black line, up to September 22, 2023, with the temperature reaching an anomaly of 1.12°C above the 1979-2000 mean for that day.


The above image shows the temperature anomaly from the 1979-2000 mean. In blue are the years 1979-2022 and in black is the year 2023 up to September 25, 2023. A trend is added in pink based on 2023 data. 

[ click on images to enlarge ]
Note that 1979-2000 isn't pre-industrial, the anomaly from pre-industrial is significantly higher. 

It looks like September 2023 will be the month with the highest temperature anomaly on record and the year 2023 will be the hottest year on record. 

The question is whether temperatures will keep rising. The current El Niño is still strengthening, as illustrated by the image on the right, adapted from IRI, and there is more to be taken into account. 


Until now, February 2016 has been the hottest month on record. The above image, from an earlier post, shows that February 2016 was 3.28°C (5.904°F) hotter than 1880-1896 on land, and 3.68°C (6.624°F) hotter compared to February 1880 on land. Note that 1880-1896 is not pre-industrial either and that sustained anomalies higher than 3°C are likely to drive humans into extinction. The image adds a poignant note: Looking at global averages over long periods is a diversion, peak temperature rise is the killer!

The situation raises questions. How much has the temperature risen? Will the temperature keep rising? What can be done about it? How can these questions best be answered?

The Paris Agreement mandate


During the UN Climate Change Conference scheduled to be held from November 30 to December 12, 2023, in Dubai, United Arab Emirates, the first Global Stocktake of the implementation of the Paris Agreement will be concluded.

The 2015 Paris Agreement mandate: Holding the increase in the global average temperature to well below 2°C above pre-industrial levels and pursuing efforts to limit the temperature increase to 1.5°C above pre-industrial levels by undertaking rapid reductions in emissions in accordance with best available science.

Many assume that the temperature rise will only threaten to cross 1.5°C above pre-industrial in the second half of this century and that by that time action will have stopped the temperature from rising, with the idea that an increase in carbon sequestration could make up for remaining emissions and avoid dangerous climate change. 

The question is whether such assumptions and decisions are indeed based on best available science, as opposed to political whim. Indeed, politicians are vulnerable to collusion with lobbyists feeding suggestions that there was a carbon budget to divide among polluters to enable polluters to keep polluting for decades to come. Local People's Courts can best rule on such questions, after taking a closer look at points such as the following: 

  • Rise from pre-industrial - While many politicians keep pushing the idea that 1.5°C above pre-industrial hasn't been crossed yet, we may already have crossed 2°C above pre-industrial, as discussed in this analysis.

  • Policy choices - emission reductions are best achieved early, rather than late. Yet, many politicians keep supporting fuel (fossil fuel and biofuels) and envisage burning of fuel to continue well beyond 2050 (combined with BECCS). Instead, when taking into account damage to health and the environment, and the danger of runaway temperature rise, it should be clear that better policies must be implemented soon, such as local feebates, to support better methods and technologies such as biochar, heat pumps and eVTOL air taxis. 

  • Rising emissions - Politicians claim that merely stating to aim for net-zero emissions will suffice to reduce emissions, whereas the evidence shows that energy-related greenhouse gas emissions have started to grow again, following minor Covid lockdown-related reductions in 2020, as illustrated by the image below, from an earlier post
[ Global energy-related greenhouse gas emissions 2000-2022, adapted from EIA ]
  • Carbon sink loss - Carbon sinks have long been taking carbon out of the atmosphere, but they are struggling and many may turn from sinks into sources and instead add carbon to the atmosphere. In 2023, nearly 2bn tons of carbon is estimated to have already gone up into the atmosphere in Canada up to now due to forest fires, far exceeding annual emissions tied to Canada’s economy (i.e. 670m tons). As temperatures rise, trees become more vulnerable to diseases and insects such as bark beetles. A 2020 study shows that at higher temperatures, respiration rates continue to rise in contrast to sharply declining rates of photosynthesis. Under business-as-usual emissions, this divergence elicits a near halving of the land sink strength by as early as 2040. As temperatures rise, soils and vegetation will lose moisture to the atmosphere. The Land Evaporation Tipping Point can get crossed locally when water is no longer available locally for further evapotranspiration from the soil and vegetation, with the rise in land surface temperatures accelerating and vegetation decaying accordingly. Higher temperatures result in more extreme weather events, such as fires, droughts, storms, flooding and erosion, that can all contribute to further decrease the terrestrial carbon sink. The ocean is also struggling as a carbon sink, in part because increased river runoff and meltwater lowers alkalinity levels. Furthermore, warmer water holds less oxygen and is becoming more stratified and thus less able to supply nutrients to help plankton grow and store carbon

  • Hydroxyl loss - There is a danger that hydroxyl, the main way that methane gets broken down in the atmosphere, is declining or getting overwhelmed by the rise in methane, as described here.

  • Heat sink loss - This recent study and this one warn that AMOC (the Atlantic meridional overturning circulation) is slowing down faster than expected. A recent post warns that this can contribute to more hot water accumulating in the North Atlantic, as opposed to moving to greater depth. The post also warns that, as temperatures rise, less heat gets stored in oceans, because stratification increases and more heat can get transferred from oceans to the atmosphere as sea ice disappears. There also are indications that, over time, proportionally more heat is remaining in the atmosphere, while less heat gets stored on land. All this results in a hotter atmosphere. 
     
  • Albedo loss - Loss of sea ice, loss of snow cover and warming oceans causing fewer bright clouds combine to reflect less sunlight back into space, as discussed here and here
  • [ Two out of numerous feedbacks ]
    Feedbacks - Important also is the accelerating rate of change. In many respects, we're in uncharted territory and changes are occurring faster than ever in Earth's history, which should be reason for caution and even more reason to plan ahead!

    The danger is growing that feedbacks are kicking in with ever greater ferocity, i.e. non-linear change. The image on the right, from an earlier post, illustrates how two self-reinforcing feedback loops can contribute to accelerate the Arctic temperature rise.

    [ click on images to enlarge ]
  • [ see the Extinction page ]
    Tipping Points - An even more dramatic form of non-linear change occurs when tipping points get crossed, and the consequences can be catastrophic for the entire world.

    The above image, from an earlier post, illustrates the danger that, as the latent heat and seafloor methane tipping points get crossed, the ocean temperature will keep rising as huge amounts of methane get released in the Arctic.

    It is essential to assess the danger of events and developments such as heat reaching and destabilizing methane hydrates contained in sediments at the seafloor of the Arctic Ocean, as discussed in many earlier posts such as this one.

    Seafloor methane is one of many elements that could jointly cause a temperature rise of over 10°C, in the process causing the clouds tipping point to get crossed that can push up the temperature rise by a further 8°C, as illustrated by the image on the right, from the extinction page

    Ominously, very high methane levels continue to be recorded at Barrow, Alaska, as illustrated by the NOAA image below.

Conclusion

Alarms bells have sounded loud and clear, such as here, warning that the temperature rise could be more than 3°C as early as in 2026. The precautionary principle should prevail and the looming dangers should prompt people into demanding comprehensive and effective action to reduce the damage and to improve the situation. To combat rising temperatures, a transformation of society should be undertaken, along the lines of this 2022 post in combination with a declaration of a climate emergency.


Links

• Climate Reanalyzer

• The International Research Institute for Climate and Society, Columbia University Climate School 

• Paris Agreement

• International Energy Agency (IEA) - Global energy-related greenhouse gas emissions 2000-2022

• NOAA - Barrow Atmospheric Baseline Observatory, United States
https://gml.noaa.gov/dv/iadv/graph.php?code=BRW&program=ccgg&type=ts

• Transforming Society
https://arctic-news.blogspot.com/2022/10/transforming-society.html

• Climate Plan
https://arctic-news.blogspot.com/p/climateplan.html

• Climate Emergency Declaration
https://arctic-news.blogspot.com/p/climate-emergency-declaration.html


Friday, December 4, 2020

Polar-ward climate zones shift and consequent tipping points

by Andrew Glikson

The concept of a global climate tipping point/s implies a confluence of climate change processes in several parts of the world where regional climate changes can combine as a runaway shifts to a new climate state. Conversely the shift of climate zones can constitute the underlying factor that triggers extreme weather events which culminate in tipping points. These shifts include the expansion of the tropics, tropical cyclones, mid-latitude storms and weakening of boundaries of the polar vortex, allowing breach of air masses of contrasting temperatures through the jet stream polar boundary, with ensuing snow storms and heatwaves.

Figure 1. Climate tipping points (McSweeney 2020)

The migration of climate zones toward the poles appears to constitute a major factor in triggering tipping points in the Earth system (Figures 1 and 2), including (from north to south):
  1. permafrost loss 
  2. expansion of the Boreal forest at the expense of the tundra
  3. disintegration of the Greenland ice sheet
  4. breakdown of the Atlantic meridional overturning circulation (AMOC) caused by an increased influx of freshwater into the North Atlantic 
  5. Amazon forest dieback 
  6. West African monsoon shift 
  7. Indian monsoon shift 
  8. Coral reef die-off
  9. West Antarctic ice disintegration
Not included in this list are the increased desertification and the extensive fires in parts of the continents, including the Arctic, Siberia, western North America, the Mediterranean, Brazil and Australia.

Figure 2. Monthly anomalies for October 2020 by NOAA (National Centers for Environmental Information)

A conflation of regional climate developments into global climate tipping point/s, namely a shift in state of the Earth climate is likely, although the details of this process are not clear. Alternatively it is the migration of climate zones toward the poles, indicated by climate zone maps, which is triggering regional events.
Figure 3. High anomalies over the Arctic from Nov. 2019 to Oct. 2020 (NASA image)

Here I list some of these likely relationships: 
  • In the Arctic sea ice extent in October 2020 was lower by 36.8% than during 1981-2010 (Figure 2). High anomalies have hit the Artic Ocean and Siberia over the 12-month period from November 2019 to October 2020 (Figure 3). The warming of the Arctic is driven by (1) a decline in albedo due to ice melt and exposure of open water surfaces; (2) the albedo flip generated by formation of thin water surfaces above ice sheets and glaciers, and (3) the penetration of warm air masses through the weakened circum-Arctic jet stream (Figure 4.). 
  • The tropics are expanding at a rate of near-50 km per decade (Jones 2018) and have widened about 0.5° latitude per decade since 1979 (Staten et al. 2018). With warming and desertification effects across North Africa and the Mediterranean Sea this is leading to draughts and fires in southern Europe. The shift of climate zones toward the poles, at a rate approximately 50 to 100 km per decade, as well as sea level rise, is changing the geography of the planet. Once sea level reaches equilibrium temperatures it will attain at least 25 meters above the present, by analogy to Pliocene level (before 2.6 million years ago).
  • As climate zones shift northward an increase of winter precipitation of up to 35% is recorded in mid to northern Europe during the 21st century, with increases of up to 30% in north-eastern Europe. In 2020 Europe had the warmest October on record and North America the heaviest snow precipitation on record (Figure 2). 
  • In Australia a southward migration of the tropical North Australia climate zone and the high pressure ridge separating it from the southern terrain dominated by the Westerlies and the precipitation-bearing spirals of the Antarctic-sourced vortex southward, with consequent droughts in southern and southwestern parts of the continent. 
Figure 4. The Arctic jet stream, summer, 1988, NASA. Extreme melting in 
Greenland’s ice sheet is linked to warm air delivered by the wandering jet 
stream, a fast-moving belt of westerly winds created by the convergence of 
cold air masses descending from the Arctic and rising warm air masses from 
the tropics that flow through the lower layers of the atmosphere.

As evident from the above the shift in climate zones constitutes the underlying factor which triggers extreme weather events and tipping points.

Figure 5. Arctic surface-air temperature anomalies for July 2020.

Since the onset of the industrial age, in particular since about 1960-70, global warming accelerated at by one to two orders of magnitude faster than during the last glacial termination (~16000 – 8000 years ago) and much earlier. Mass extinction events in the Earth history have occurred when environmental changes took place at a rate to which species could not adapt. Plants and animals are currently dying off at a rate 100 to 1000 times faster than the mean rate of extinction over geological timescales.

The Intergovernmental Panel for Climate Change (IPCC AR5) projects linear warming to 2300 and 2500, which however does not take full account of amplifying feedbacks from a range of sources (Trajectories of the Earth system in the Anthropocene). These include reduced CO2 sequestration in the warming oceans, albedo changes due to melting of ice, enrichment of the atmosphere in water vapor, desiccation and burning vegetation, release of methane from permafrost. Nor do these linear trends take account of the stadial effects of the flow of cold ice melt water into the oceans (Glikson, 2019).

According to the National Oceanic and Atmospheric Agency (NOAA) global warming has accelerated significantly during 2015-2020. The danger inherent in temperature rise to about 4 degrees Celsius by 2100 is underpinned by the consequences at lower temperature rise of +1 to +2 degrees Celsius, already in evidence. Thus, whereas the mean land-ocean temperature rise between 1880-2020 is +1.16 degrees Celsius, the average rise in continental temperatures during this period has already reached +1.6 degrees Celsius, beyond the upper limit proposed by the Paris Accord. The rise in temperatures is driving a three-fold to six-fold rise in extreme weather events since 1980 (Figure 6.), including severe storms, tropical storms, flooding, droughts and wildfires (NOAA 2018).

Figure 6. The growth in the frequency of extreme weather events in the US during 1980-2018

Large-scale melting of the Greenland and Antarctica ice sheets, discharging cold ice melt water, is already cooling of parts of the oceans. The clash between cold air masses and tropical fronts would increase storminess, in particular along coastal boundaries and islands. Such storminess, along with intensified tropical cyclones, would render island chains increasingly vulnerable.

To date most suggestions for mitigation and adaptation are woefully inadequate to arrest global warming. Reductions in carbon emissions, which are absolutely essential, may no longer be adequate to arrest accelerating greenhouse gas and temperature levels. At the current level of carbon dioxide (>500 parts per million equivalent CO2+methane+nitrous oxide), reinforced by amplifying feedbacks from land and oceans, the remaining option would be to sequester (down-draw) greenhouse gases from the atmosphere.

A global imperative.


Andrew Glikson

Dr Andrew Glikson
Earth and Paleo-climate scientist
ANU Climate Science Institute
ANU Planetary Science Institute
Canberra, Australia


Books:
The Asteroid Impact Connection of Planetary Evolution
http://www.springer.com/gp/book/9789400763272
The Archaean: Geological and Geochemical Windows into the Early Earth
http://www.springer.com/gp/book/9783319079073
Climate, Fire and Human Evolution: The Deep Time Dimensions of the Anthropocene
http://www.springer.com/gp/book/9783319225111
The Plutocene: Blueprints for a Post-Anthropocene Greenhouse Earth
http://www.springer.com/gp/book/9783319572369
Evolution of the Atmosphere, Fire and the Anthropocene Climate Event Horizon
http://www.springer.com/gp/book/9789400773318
From Stars to Brains: Milestones in the Planetary Evolution of Life and Intelligence
https://www.springer.com/us/book/9783030106027
Asteroids Impacts, Crustal Evolution and Related Mineral Systems with Special Reference to Australia
http://www.springer.com/us/book/9783319745442


Sunday, April 19, 2020

The Fatal Road To 4 Degrees Celsius

The fatal road to +4°Celsius
Extreme GHG and T°C rise rates exceed climate tipping thresholds

Andrew Glikson

Precis

Global CO₂ rise and warming rates have reached a large factor to an order of magnitude higher than those of the past geological and mass extinction events, with major implications for the shift in climate zones and the nature and speed of current extreme weather events. Given the abrupt change in state of the atmosphere-ocean-cryosphere-land system, accelerating since the mid-20ᵗʰ century, the terms climate change and global warming no longer reflect the nature of the climate extremes consequent on this shift. Further to NASA’s reported mean land-ocean temperature rise to +1.18°C for March 2020, relative to the 1951-1980 baseline, large parts of the continents, including Siberia, central Asia, Canada, parts of west Africa, eastern South America and Australia are warming toward mean temperatures of +2°C and higher. The rate exceeds that of the Last Glacial Termination (LGT) (21–8 kyr), the Paleocene-Eocene hyperthermal event (PETM) (55.9 Ma) and the Cretaceous-Tertiary boundary (K-T) (64.98 Ma) impact event. A principal question arises regarding the relationships between the warming rate and the nature and progression of the current migration climate zones toward the poles, including changes in the atmosphere and ocean current systems. Significant transient cooling pauses, or stadials, are projected as a consequence of the flow of cold ice melt water from Greenland and Antarctica into the oceans.

Figure 1. Global temperature distribution in March 2020, relative to a 1951-1980 baseline. NASA GISS.


The K-T impact and subsequent warming: According to Beerling et al. (2002) the CO₂ change triggered by the K-T impact event 65 Ma years ago involved a rise from about 400-500 ppm to 2300 ppm over 10.000 years from the impact (Fig. 2) at a rate of 0.18 ppm/year. This is less than the mean Anthropocene CO₂ rise rate of 0.415 ppm/year and an order of magnitude less than the 2 to 3 ppm/year rise rate in the 21ˢᵗ century. Likewise the Anthropocene temperature rise rate of ~ 0.0074°C/year is high by an order of magnitude as compared to the K-T impact event rate of~ 0.00075°C/year (Table 1) reported by Beerling et al. (2002).

Figure 2. Reconstructed atmospheric CO₂ variations during the Late Cretaceous–Early Tertiary derived from the SI
(Stomata index) of fossil leaf cuticles calibrated by using inverse regression and stomatal ratios. Beerling et al. (2002).
Beerling et al.’s (2002) estimate, based on fossil fern proxies, implies an initial injection of at least 6,400 GtCO₂  and possibly as high as 13,000 GtCO₂ into the atmosphere, significantly higher than values derived by Pope et al. (1997). This would increase climate forcing by +12 Wm⁻² and mean warming of ~7.5°C, which would have strongly stressed ecosystems already affected by cold temperatures and the blockage of sunlight during the impact winter and associated mass extinction at the KT boundary (O’Keefe et al. 1989).

The PETM hyperthermal event: The Palaeocene–Eocene Thermal Maximum, about 55.9 Ma, triggered the release of a large mass of light ¹³C-depleted carbon suggestive of an organic source, likely methane, has led to a global surface temperature rise of 5 – 9°C within a few thousand years (Table 1; Fig. 3). Deep-sea carbonate dissolution indices and stable carbon isotope composition were used to estimate the initial carbon pulse to a magnitude of 3,000 PgC or less. As a result, atmospheric carbon dioxide concentrations increased during the main event by up to 70% compared with pre-event levels, leading to a global surface temperatures rose by 5–9°C within a few thousand years.

Figure 3. Simulated atmospheric CO2 at and after the Palaeocene-Eocene boundary (after Zeebe et al. (2009).

The last glacial termination: Paleoclimate indices based on ice cores and isotopic evidence suggest temperature rise generally correlates with CO₂ during the Last Glacial Termination between 17.5 kyr to 10 kyr. Whereas the rise rates of CO₂ and temperature are broadly parallel the temperature somewhat lags behind CO₂ (Figure 2). Changes of CO₂ – 186 - 265 ppm and of temperature of T°C -3.3°C - +0.2°C (Fig. 4). A rise rate of ~0.010 ppm CO₂/year and of temperature ~0.00046°C/year are indicated (Table 1) (Shakun et al., 2012). Differences between temperature changes of the Northern Hemisphere and Southern Hemisphere correspond to variations in the strength of the Atlantic meridional overturning circulation.
Figure 4. Global CO₂ and temperature during the last glacial termination (After Shakun et al. 2012).
(LGM – Last Glacial Maximum; OD – Older Dryas; B-A - Bølling–Allerød; YD Younger Dryas).
Trajectories and rates of global CO₂ rise and warming

The rates at which atmospheric composition and climate changes occur constitute major control over the survival versus extinction of species. Based on paleo-proxy estimates of greenhouse gas levels and of mean temperatures, using oxygen and carbon isotopes, fossil plants, fossil organic matter, trace elements, the rate of CO₂ rise since ~1750 (Anthropocene) (CO₂ ᴀɴᴛʜ) exceeds that of the last glacial termination (CO₂ ʟɢᴛ) by an order of magnitude (CO₂ ᴀɴᴛʜ/CO₂ ʟɢᴛ = 41) and that of the Paleocene-Eocene Thermal Maximum (CO₂ ᴘᴇᴛᴍ) by a high factor (CO₂ ᴀɴᴛʜ/CO₂ ᴘᴇᴛᴍ ~ 3.8–6.9)(Table 1). The rise rate of mean global temperature exceeds that of the LGT and the PETM by a large factor to an order of magnitude (Table 1; Figs 5 and 6). It can be expected that such extreme rates of change will be manifest in real time by observed shifts in state of global and regional climates and the intensity and frequency of extreme weather events, including the following observations:
The rapid increase in extreme weather events,including droughts, heat waves, fires, cyclones and storms.
Figure 5. Cenozoic and Anthropocene CO₂ and temperature rise rates.

Figure 6. A comparison between rates of mean global temperature rise during:
(1) the last Glacial Termination (after Shakun et al. 2012);
(2) the PETM (Paleocene-Eocene Thermal Maximum, after Kump 2011);
(3) the late Anthropocene (1750–2019), and
(4) an asteroid impact. In the latter instance, temperature associated with
CO₂ rise would lag by some weeks or months behind aerosol-induced cooling.
Figure 7. An updated Köppen–Geiger climate zones map.

By contrast to linear IPCC climate projections for 2100-2300, climate modelling for the 21st century by Hansen et al. 2016 suggests major effects of ice melt water flow into the oceans from the ice sheets, leading to stadial cooling of parts of the oceans, changing the global temperature pattern from that of the early 21ˢᵗ century (Figs 8, 9a) to the late 21ˢᵗ century (Fig. 9b).
Figure 8. Global temperature patterns during El Nino and La Nina events. NASA GISS

Figure 9. a. An A1B model of surface-air temperature change for 2055-2060 relative
to 1880-1920 (+1 meters sea level rise) for modified forcing (Hansen et al. 2016);
b. A1B model surface-air temperatures in 2096 relative to 1880-1920 (+5 meters sea level rise) for 10 years
ice melt doubling time in the southern hemisphere and partial global cooling of -0.33
°C (Hansen et al. 2016).

Summary and conclusions

  1. Late 20th century to early 21asrt century global greenhouse gas levels and regional warming rates have reached a high factor to an order of magnitude faster than those of past geological and mass extinction events, with major implications for the nature and speed of extreme weather events.
  2. The Anthropocene CO₂ rise and warming rates exceed that of the Last Glacial Termination (LGT) (21–8kyr), the Paleocene-Eocene hyperthermal event (PETM) (55.9 Ma) and the post-impact Cretaceous-Tertiary boundary (K-T) (64.98 Ma). 
  3. Further to NASA’s reported mean land-ocean temperature rise of +1.18°C in March 2020, relative to the 1951-1980 baseline, large parts of the continents, including central Asia, west Africa eastern South America and Australia are warming toward mean temperatures of +2°C and higher. 
  4. Major consequences of the current shift in state of the climate system pertain to the weakening of the polar boundaries and the migration of climate zones toward the poles. Transient cooling pauses are projected as a result of the flow of cold ice melt water from Greenland and Antarctica into the oceans, leading to stadial cooling intervals.
  5. Given the abrupt shift in state of the atmosphere-ocean-cryosphere-land system, the current trend signifies an abrupt shift in state of the atmosphere, accelerating since the mid-20th century. Terms such as climate change and global warming no longer reflect the extreme nature of the climate events consequent on this shift, amounting to a climate catastrophe on a geological scale.
Andrew Glikson
Dr Andrew Glikson
Earth and Paleo-climate scientist
ANU Climate Science Institute
ANU Planetary Science Institute
Canberra, Australian Territory, Australia
geospec@iinet.net.au

Books:
The Asteroid Impact Connection of Planetary Evolution
http://www.springer.com/gp/book/9789400763272
The Archaean: Geological and Geochemical Windows into the Early Earth
http://www.springer.com/gp/book/9783319079073
Climate, Fire and Human Evolution: The Deep Time Dimensions of the Anthropocene
http://www.springer.com/gp/book/9783319225111
The Plutocene: Blueprints for a Post-Anthropocene Greenhouse Earth
http://www.springer.com/gp/book/9783319572369
Evolution of the Atmosphere, Fire and the Anthropocene Climate Event Horizon
http://www.springer.com/gp/book/9789400773318
From Stars to Brains: Milestones in the Planetary Evolution of Life and Intelligence
https://www.springer.com/us/book/9783030106027
Asteroids Impacts, Crustal Evolution and Related Mineral Systems with Special Reference to Australia
http://www.springer.com/us/book/9783319745442 

From Stars to Brains: Milestones in the Planetary Evolution of Life and Intelligence

The Plutocene: Blueprints for a Post-Anthropocene Greenhouse Earth

Added below is a video with an August 6, 2019, interview of Andrew Glikson by Guy McPherson and Kevin Hester, as edited by Tim Bob.